Tribe Hub
Features
Tribe Hub
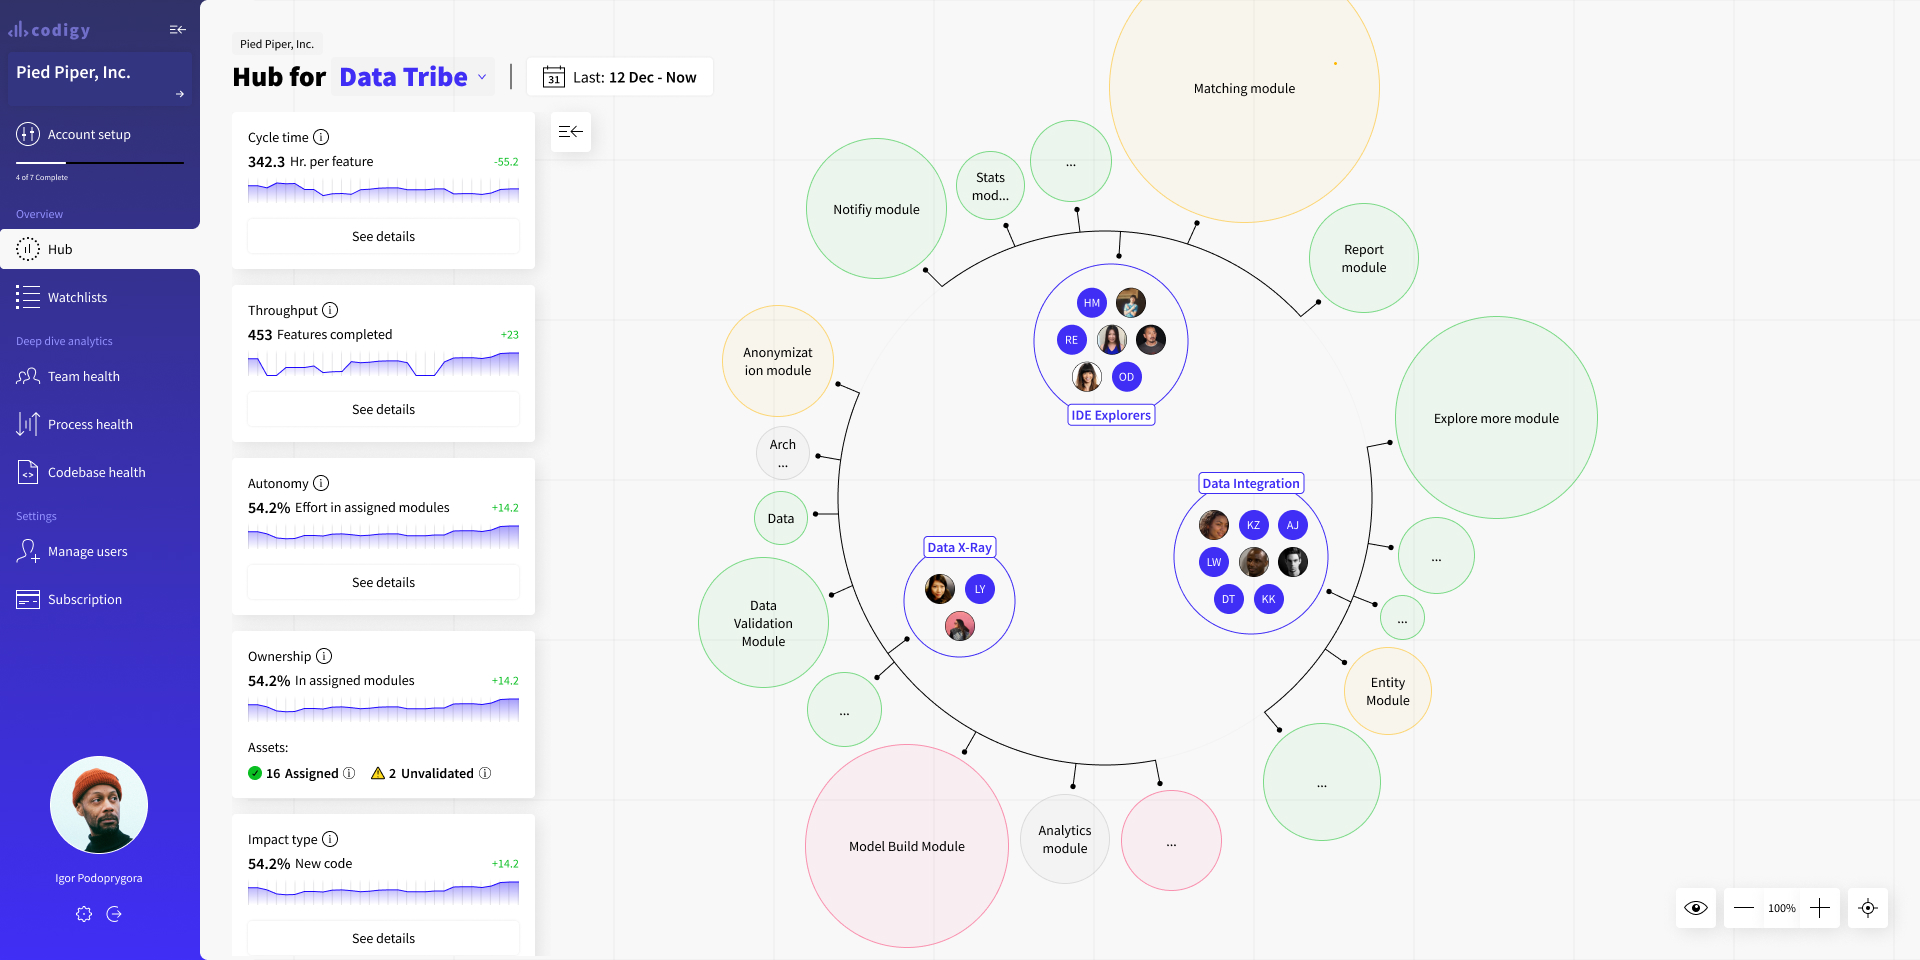
Every general and special ops team needs a map - this is it. Zoom in and out between Tribe (Domain) and Team maps to check the health of the team and code assets.
A Tribe map is generated for each of your tribes. It visualizes:
What modules(assets) team is responsible for;
Size of each module;
Key health metrics for the team, codebase, and processes;
Directors of engineering, Engineering managers get visibility and key metrics for governance, and strategic planning:
Cycle time & Throughput (Part of DORA);
Team autonomy;
Factual ownership grade within assigned modules;
Impact by type: New code, Churn, Maintenance;
Complexity and size of the assigned modules;
All pivotable by team or granular per module. It is a perfect tool to:
Balance load and responsibility areas between your teams;
Make decisions for further decoupling or team structure changes;
Check the overall health of your tribe;
Find rich context in one click on the map:
Go into Module Map, to get a map, insights, and review changes made to this asset;
Go into the Decoupling tool, to get an interactive map of all changes teams made in the selected period.
Zoom in to Team Hub to see detailed insights for your team;
Zoom out into All Modules to see a bigger picture.
Have a question?
Need a more detailed explanation about any of the Codigy metrics or mechanics? Fire away in our community chat on Discord 👌
This page was last revised on January 19, 2023
Return to main