Context map
Features
Context map
The gist
This tool helps you validate your domain design. Well-designed domains will change independently from each other.
Whether you already have an established domain design or just drafting your first assumptions, you will be able to quickly identify and measure violations.
What is a violation
If a feature branch changes two modules - it's a violation. These violations can occur between modules inside a domain, or between domains.
Context map
This map groups your codebase elements (modules, repositories) into domains.
Connection between the domains and the percentage displayed - indicates violation severity (How frequently feature branches changes impact modules in both domains).
Hovering over a domain, highlights the connections with other domains and modules with most violations (red color intensity = higher violation count).
Hover over a connection between domains - highlights modules where these violations where detected.
Click on the connection opens Coupling trace, click on the module open Module Insights.
Map can be filtered by:
→ Repositories (All repositories, or selected repositories)
→ Date range
Scope & threshold
All features observed in the selected date range are grouped by prefix and displayed in the side panel.
You can disable prefix groups or individual features to reduce the noise (i.e. if you are currently doing some refactoring work).
Additionally, threshold controller allows you to hide weak coupling links between domains, helping you focus on the most important issues👇
Domain autonomy
Answers a question: "Out of all the changes that impacted a domain, how many only changed the code that belongs to this domain?".
The answer is provided in the form of percents for each domain. A high percentage means good domain design.
Module violations
A side panel contains a list of all modules (or repositories if modules are not configured). The list is sorted by violation count that was observed in a given period - the best way to pick targets for decoupling.
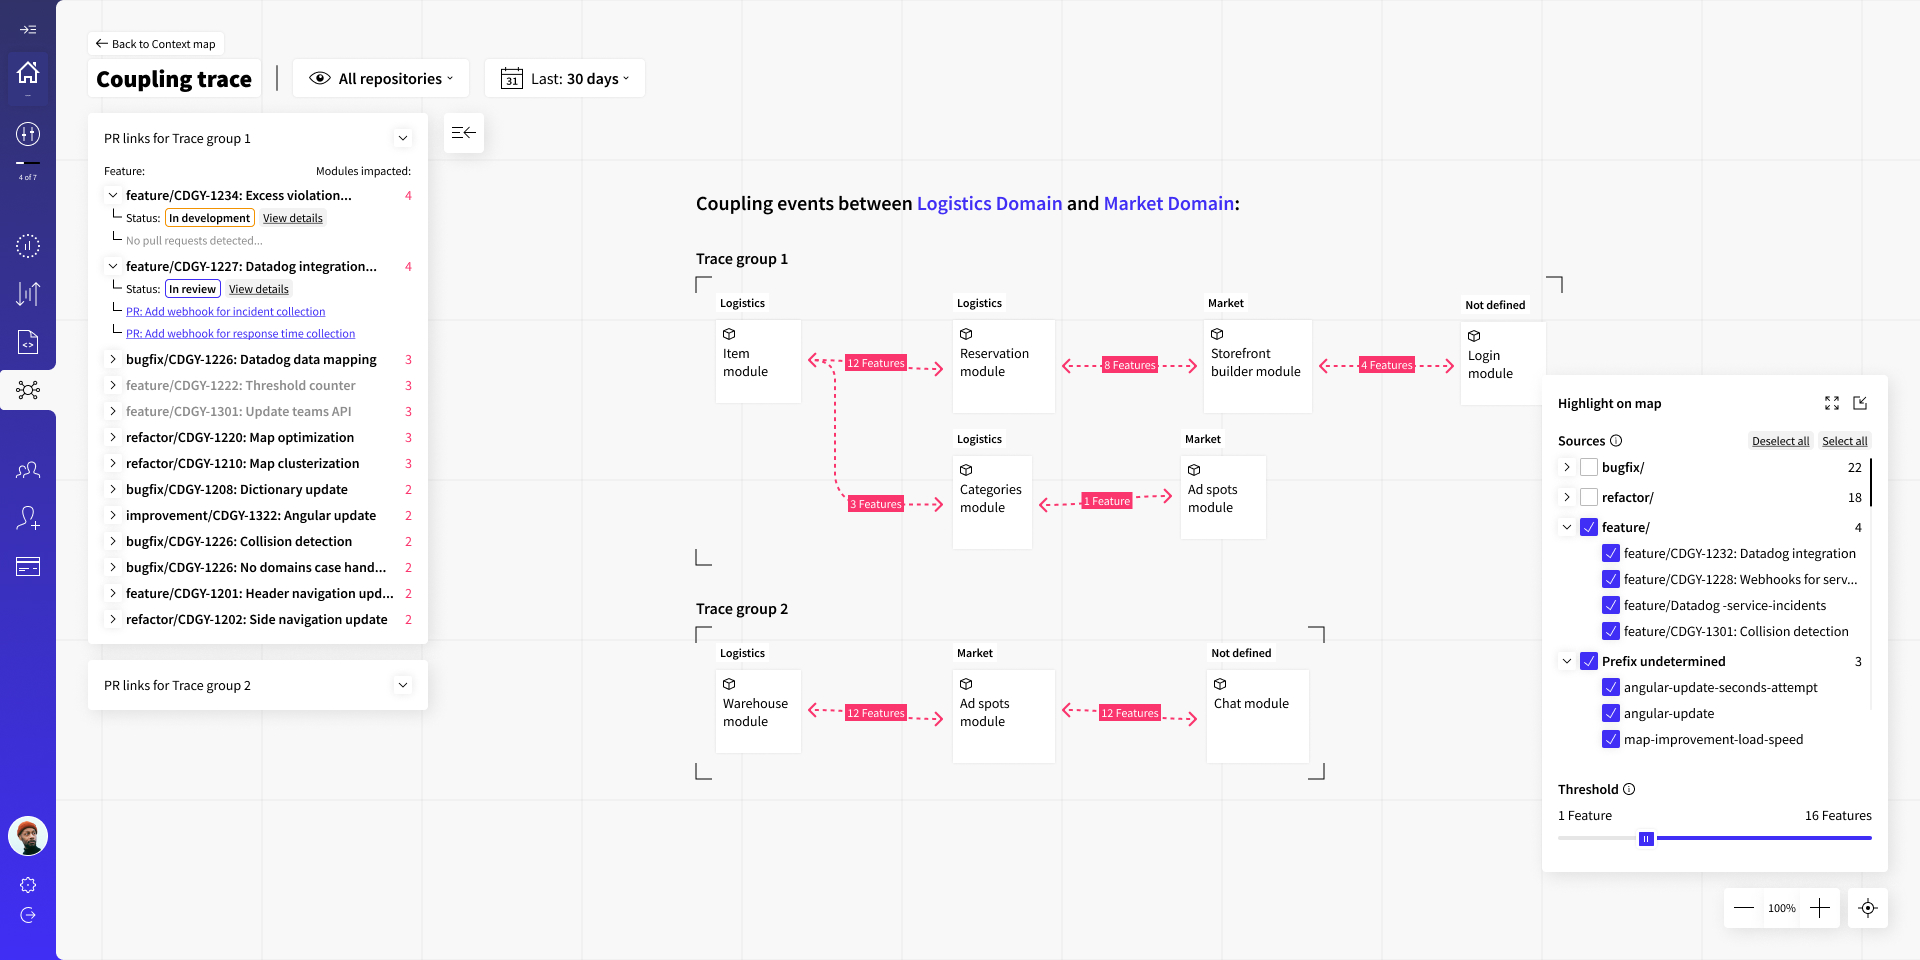
Coupling Trace
Once you have selected a pair of domains you wish you investigate, you can click on their connection line to dive deeper:
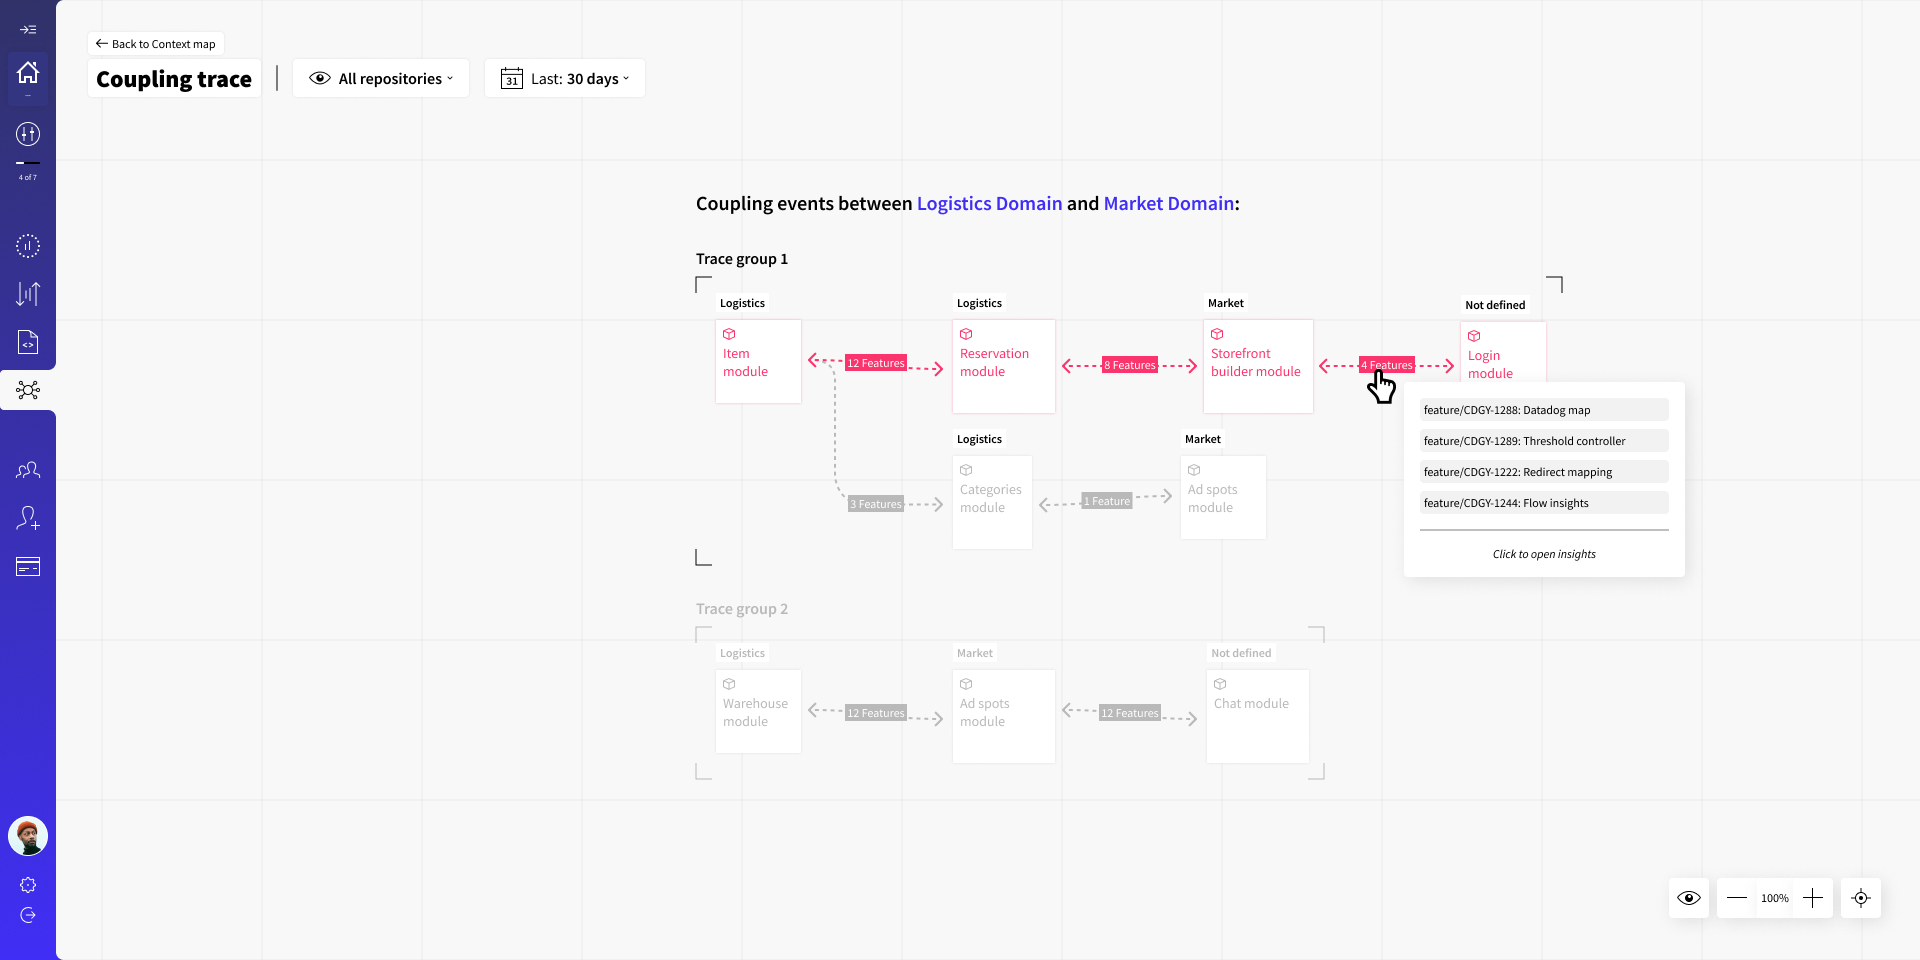
Essentially, what you are looking at are trails your engineers take to deliver value (features/maintenance work). If this doesn't match your domain/module design expectations, well you will have to investigate🤷♂️
This screen does quite a bit of leg-work for you:
It looks up all the feature branches that affected code in both domains;
If multiple feature branches affect the same modules more than once, this map will group them into trace groups;
It will provide stats for the frequency of changes between modules, group links to PRs, and give a list of the most frequently changed files to jump-start your investigation;
Same as the previous screen, this can be filtered by repository, date, and feature prefix. Low-strength coupling can be muted with a threshold controller.
Have a question?
Need a more detailed explanation about any of the Codigy metrics or mechanics? Fire away in our community chat on Discord, or Slack channel (in case your organization is using our Slack Connect support) 👌
This page was last revised on October 17, 2023
Return to main