Team Hub
Features
Team Hub
The gist
Good decisions require well-structured data. We gathered and visualized team structure, related codebase assets, interactions with other teams, and key health metrics. Now, you have everything by your hand to run a retrospective, track overall health, or make deep-dive investigations.
Map
An interactive map shows team structure, codebase assets and effort distribution. It also shows interactions with other teams or tribes:
Map structural elements
Selected team
Team Hub Map is constructed from a perspective of a selected team (Green color card on the image above).
Team card lists all your team members (in case something is odd, navigate to Org. chart to make changes in your team).
Lines that originate on the team card and point to modules or repositories represent WIP & Merged feature branches observed in the selected period. Line color and percentage displayed correlate with autonomy widget and help understand if we mess with code owned by other domains and teams or not.
Clicking on View button will redirect to Effort Trace Map where you will be able to investigate changes made by the team on a lower, more detailed level.
Other teams
In case other teams have changed modules of the selected team, they will be displayed on the map. Click on the team card to see their impact.
Other teams are sorted based on organizational structure. Teams from the same domain will be displayed on the left, and teams from other domains will be displayed on the right.
Module groups
All modules and codebase elements are organized into groups according to ownership. The source of truth for ownership can vary, i.e. CODEOWNERS files or assigned through Codigy.
Depending on the selected map filter, module cards can either display the throughput or cycle time of the selected team. Click on the module to access Module Insights Map.
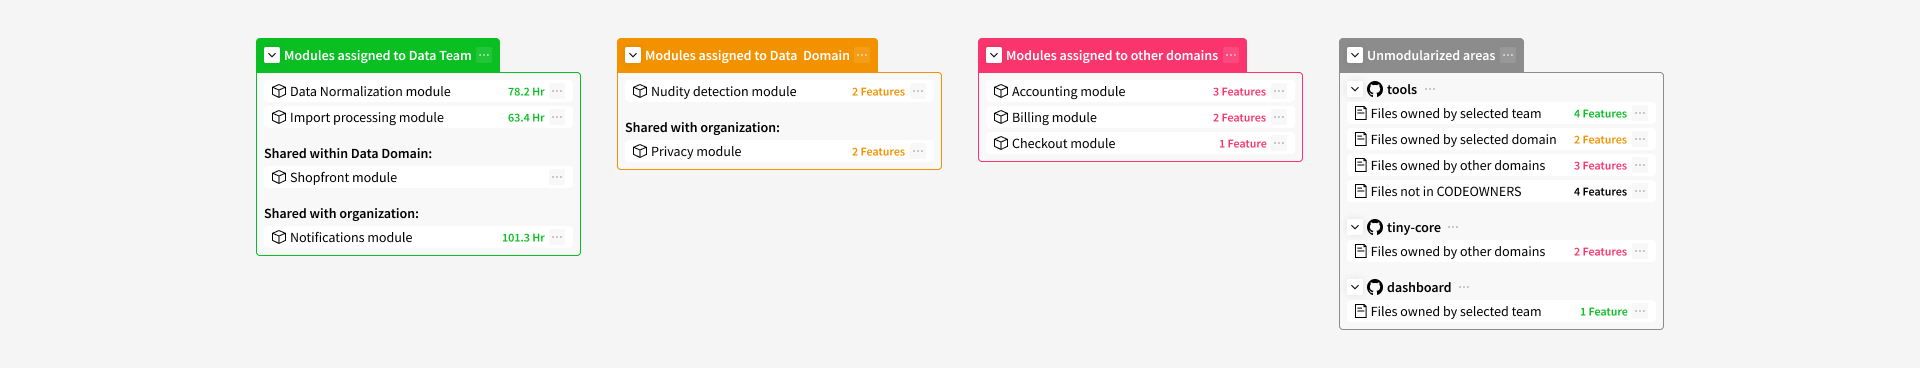
Effort in the unmodularized codebase
In case a team is doing work in the files that are not part of modules, the map will organize files according to ownership. Source of truth for ownership in CODEOWNERS file. In case you don't have such a file, all files will be marked as "Files not in CODEOWNERS".
Map Filters
Highlight different datasets based on the problem you are investigating:
1. Impact
This filter displays a count of features authored by the team on each module or repository.
2. Cycle time
Measures the cycle time of the team per relationship with each module or repository.
3. Confidence
Filter visualizes the team confidence score for each codebase element displayed map.
4. Refactoring targets
Counts the number of identified refactoring targets (relevant to the selected team) on each codebase element on this map.

Team health metrics
Can this team execute its roadmap effectively? To answer this, we evaluate all aspects of the value delivery process:
Code health. Identifies technical inefficiencies in files;
Process health. It measures Cycle time and anti-patterns like oversized PRs or multitasking.
Organization design. Evaluation of team autonomy, confidence, and ownership.
Out of the box, you get root-cause insights, trends, and ability to deep-dive into evidence 🕵️
Refactoring targets
This widget shows how frequently the team encounters technical debt in their work. You can click on the widget to explore a prioritized list of refactoring targets served with evidence and explanations.

Why is this important?
Technical debt slows down your development, ruins developer experience and increases overall risks for the product. Use this instrument to:
Evaluate how much technical debt you have accumulated and how it impacts your team;
Pick refactoring targets from a prioritized list;
Communicate the need for refactoring to the stakeholders using gathered evidence;
Organize work-groups for technical debt that affects more than one team or domain;
How does this work?
Codigy continiously checks each file for indications of technical issues. We use multiple parameters such as cyclomatic complexity, file size, frequency of use and others to define what files are hotspots.
Codigy checks how many features authored by the team have encountered the hotspots in the selected date range.
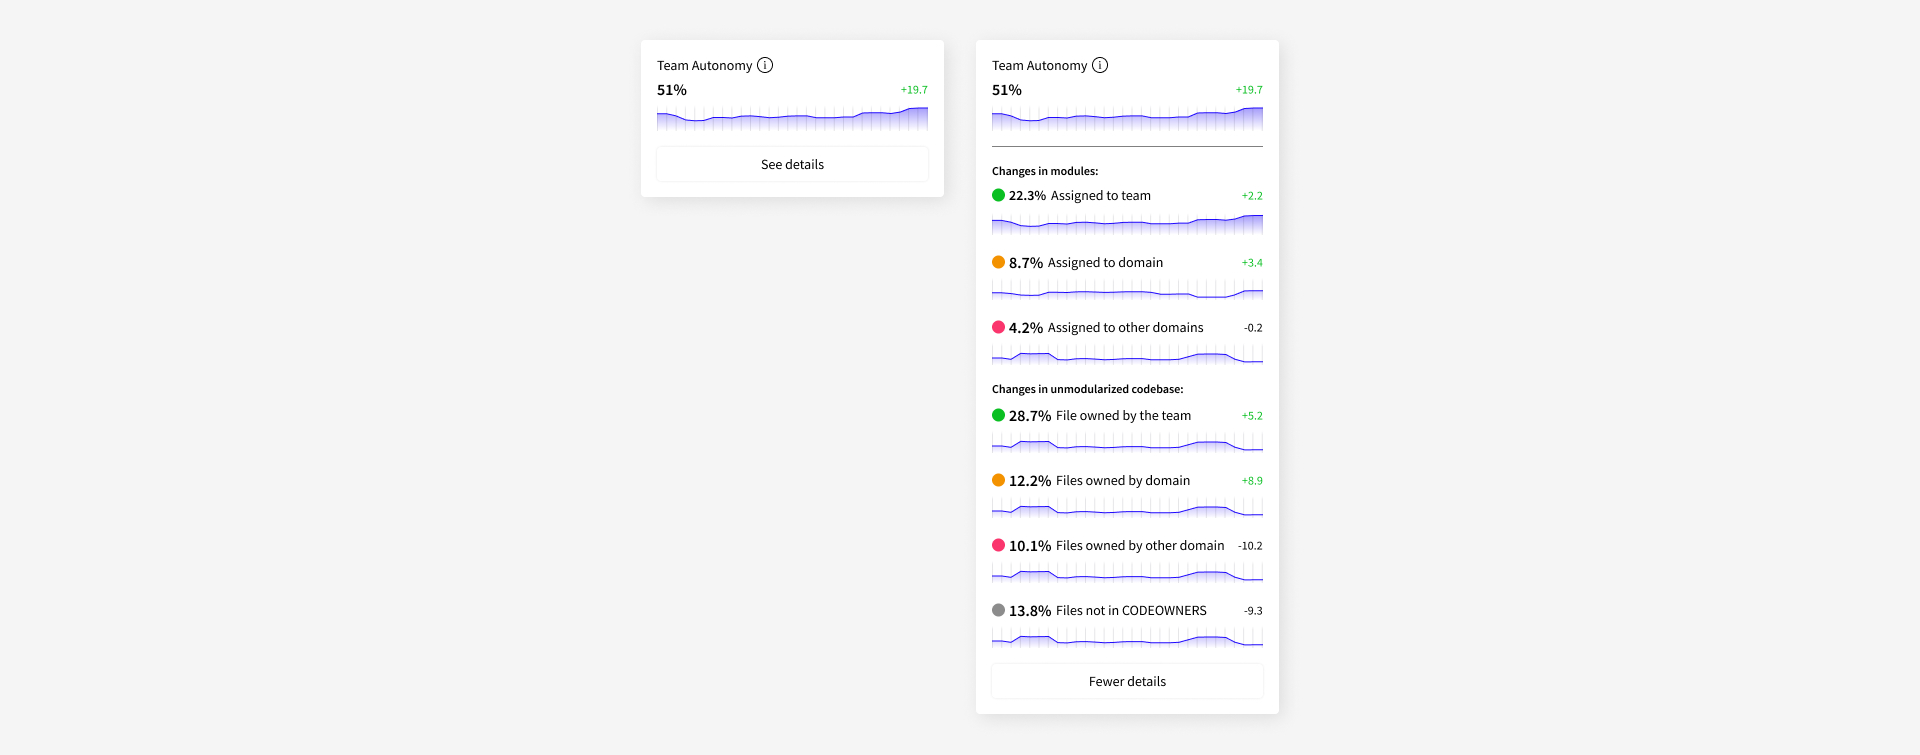
Autonomy
This simple numerical value helps you understand if the team is able to achieve its goals only by working with the code that is assigned to them. In case they need to change files that belong to other teams or domains, you will be able to see the extent of this issue.
Why is this important?
Low autonomy means lower efficiency and a higher risk of defects:
Changing the code that belongs to other teams usually requires their review and approval, which takes longer;
Stepping on each other's work and doing changes in code that you are not familiar with increases the chance of defects;
How does this work?
All files are grouped into categories based on ownership. Files that belong to modules use owners assigned in Codigy, files that are not part of any modules use CODEOWNERS file if it is available.
All team changes are sorted into categories with a breakdown available in the interface. Team autonomy is then calculated, it is a sum of activity in modules and files where the team is mentioned as an owner.
Confidence
It plays an important role in helping you assign the most experienced team for each area of the code (file, folder, repository, or module).

Why is this important
1. If a team has high confidence in the modules & files that are assigned to them - it is a great sign that shows you have picked the right team to maintain and protect this code.
2. If a team has high confidence in modules & files that are assigned to other domains - it is an indicator that either owner was not assigned correctly or files are shared between teams and need to be decoupled.
In case you spot something odd in the Confidence score, you can click on the "View on map" to see Team confidence patterns on an interactive Ownership map.
How does this work
Similar to the Autonomy widget, Confidence looks into the activity patterns of the team in files grouped by ownership. However, Confidence:
Is based on observing patterns in a rolling period of 6 months which evens out data volatility and works well with the limitation of human memory;
Takes rewrites into account (i.e. if a file was originally authored by the team 1 month ago, but was completely rewritten by another team afterwards, the confidence of the initial authors will drop to 0%);
Cycle time
Map deals with cycle time per relationship. This widget gives us overall team measurements:
What is the average cycle time of this team?
How long was each stage (Development, Review, Integration)?
How many features took longer than your estimates?
How many features did we complete?
How many features got stuck in idle or stale?
How many anti-patterns did we detect? For example oversized PRs.

Click on any insight and get a filtered list. For example, all idle features, oversized PRs, or those that got stuck in review. List loads the Feature insights to give you all relevant context.
Why is this important
Time from the idea to market is a good business metric. Use it to:
Communicate with the stakeholders. All departments understand it.
Track team health. Compare your cycle time with previous periods or other teams. If your cycle time is increasing, look for a root cause.
Understand the root cause. Use cycle time along with with ownership, confidence and code health context. Full context clarifies if you need to refactor, decouple or make changes in your organization design.
How does this work
Cycle time is calculated based on the time between events in the feature.
Feature can be a single branch or associate multiple branches based on name or Ticket ID matching. Configure this in Feature Definition.
Data scope includes work-in-progress features, as well as completed in the selected period.
Widget excludes Stale & ignored feature branches.
Data in cycle time widget is sensitive to a repository scope and date range selection.
Have a question?
Need a more detailed explanation about any of the Codigy metrics or mechanics? Fire away in our community chat on Discord, or Slack channel (in case your organization is using our Slack Connect support) 👌
This page was last revised on November 2, 2023
Back to main